Carbon Graphite Grafana - on a Raspberry Pi
This story starts in IoT class: read out 2 a light and temperature sensor and send it to a MySQL database. Piece of cake! Simple SQL select, parsing into JSON passing to Graph.js and here we go.
 Heh, this is fun let’s set up my OpenVPN on the Pi and a reverse proxy to make it accessible from everywhere. (why dynamic DNS if you can make it more complicated but firewall bypassing)
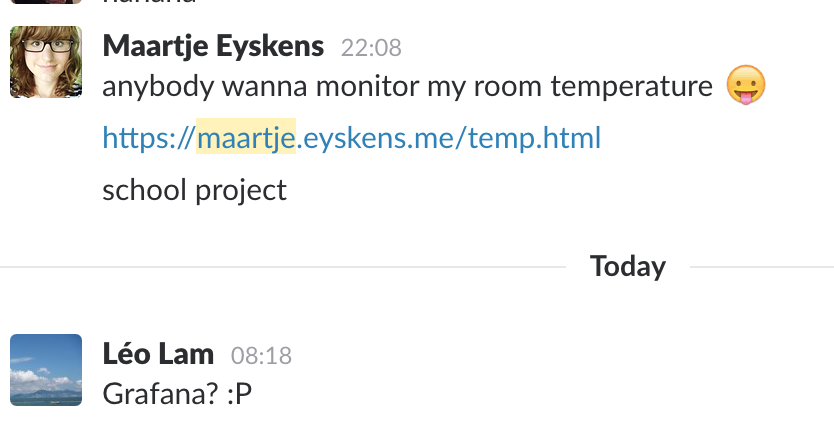 Not even 24 hours later Léo (as a joke) suggests Grafana. So why not!
So let’s get started. First on we need a storage backend, just the classic Grafana, Graphite so sounds like Carbon! The lovely Debian people seem to already have it ready so simply:
apt-get install graphite-carbon
Then fixing up /etc/default/graphite-carbon to set CARBON_CACHE_ENABLED=true.
I edited /etc/carbon/carbon.conf to only listen on localhost (you never know in what network you bring your Pi).
Now we have Carbon listening for data input it’s time for the API. After installing the Graphite API (http://graphite-api.readthedocs.io/en/latest/installation.html#python-package) we’ll have to edit /etc/graphite-api.yml to make it work.
search_index: /var/lib/graphite/index
finders:
  - graphite_api.finders.whisper.WhisperFinder
functions:
  - graphite_api.functions.SeriesFunctions
  - graphite_api.functions.PieFunctions
whisper:
  directories:
    - /var/lib/graphite/whisper
carbon:
  hosts:
    - 127.0.0.1:7002
  timeout: 1
  retry_delay: 15
  carbon_prefix: carbon
  replication_factor: 1
(all credit to https://markinbristol.wordpress.com/2015/09/20/setting-up-graphite-api-grafana-on-a-raspberry-pi/)
To make it usable we need to install libapache2-mod-wsgi to Apache (if you don’t know how to install that how could you have read this far??)
All left to do is editing a few files:
# /var/www/wsgi-scripts/graphite-api.wsgi

from graphite_api.app import app as application
# /etc/apache2/sites-enabled/graphite.conf
LoadModule wsgi_module modules/mod_wsgi.so
WSGISocketPrefix /var/run/wsgi
Listen 8013
<VirtualHost 127.0.0.1:8013>

 WSGIDaemonProcess graphite-api processes=5 threads=5 display-name='%{GROUP}' inactivity-timeout=120
 WSGIProcessGroup graphite-api
 WSGIApplicationGroup %{GLOBAL}
 WSGIImportScript /var/www/wsgi-scripts/graphite-api.wsgi process-group=graphite-api application-group=%{GLOBAL}

 WSGIScriptAlias / /var/www/wsgi-scripts/graphite-api.wsgi

 <Directory /var/www/wsgi-scripts/>
 Order deny,allow
 Allow from all
 </Directory>
 </VirtualHost>
(again, all credit to https://markinbristol.wordpress.com/2015/09/20/setting-up-graphite-api-grafana-on-a-raspberry-pi/)
Restart Apache and now it is time for the fun parts!
Before we get into installing Grafana let’s feed some data into it! The script is simple, reading out an AD converter out via SPI every 10 seconds parsing the data (eg. converting the temperature of the LM35) then opening a TCP socket to Carbon sending the data and time (in a very simplistic format) and closing the socket. Let that run on the background and it’ll feed all data needed for the next step.
Grafana has no official ARM release but that doesn’t stop us from compiling it! (uh… no let’s keept it simple here it is weekend anyway). Good there is a pre-compiled version available on GitHub. Download the deb, installing it and we have a fresh server on port 3000.
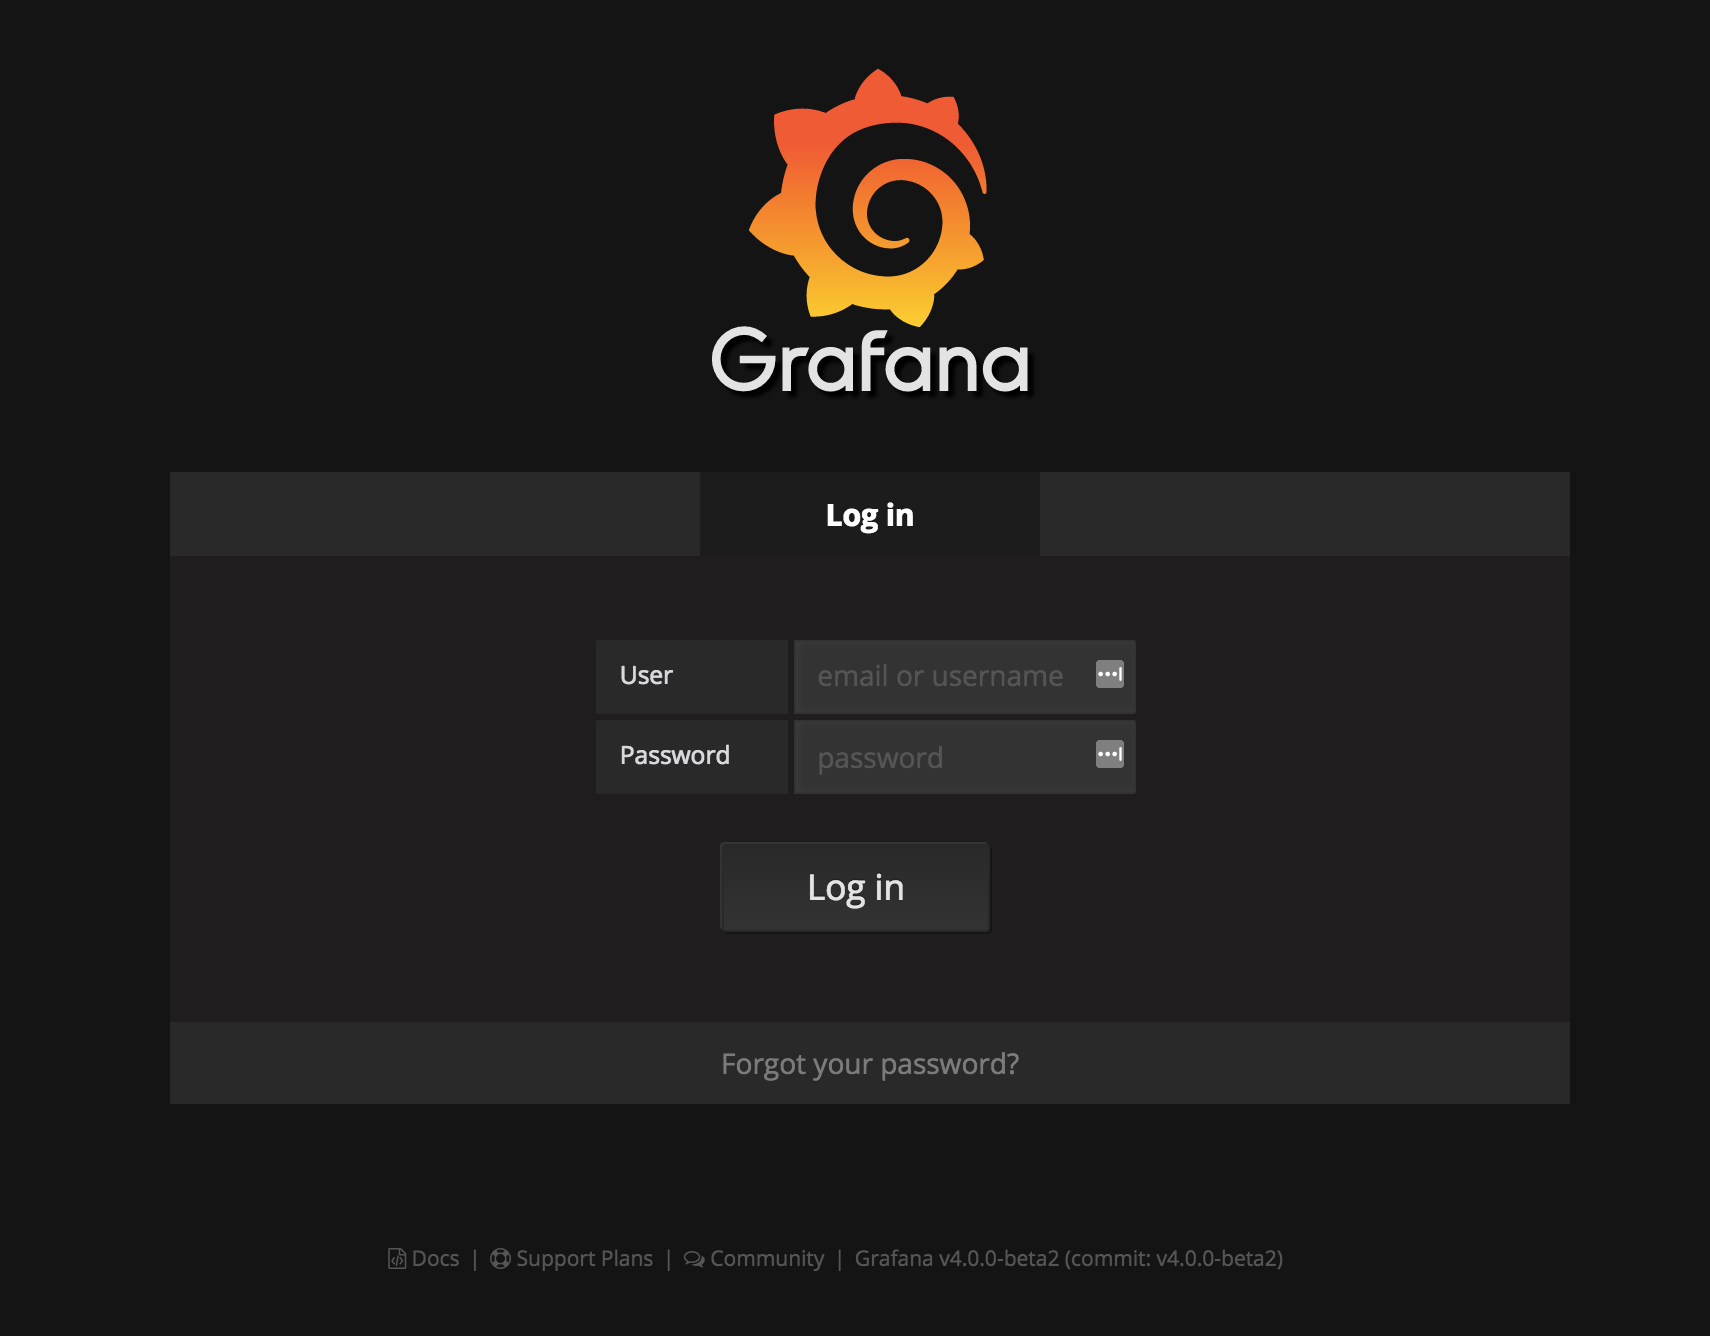 The default login is admin:admin so we can get in (tip: open the config file and disable signup). Next up is adding a data source in our case Graphite with the url of the localhost server created a few steps ago (if you both have IPv6 and IPv4 on the Pi and you copy pasted my previous code but not these settings you might get in trouble as I set Apache to only use IPv4)
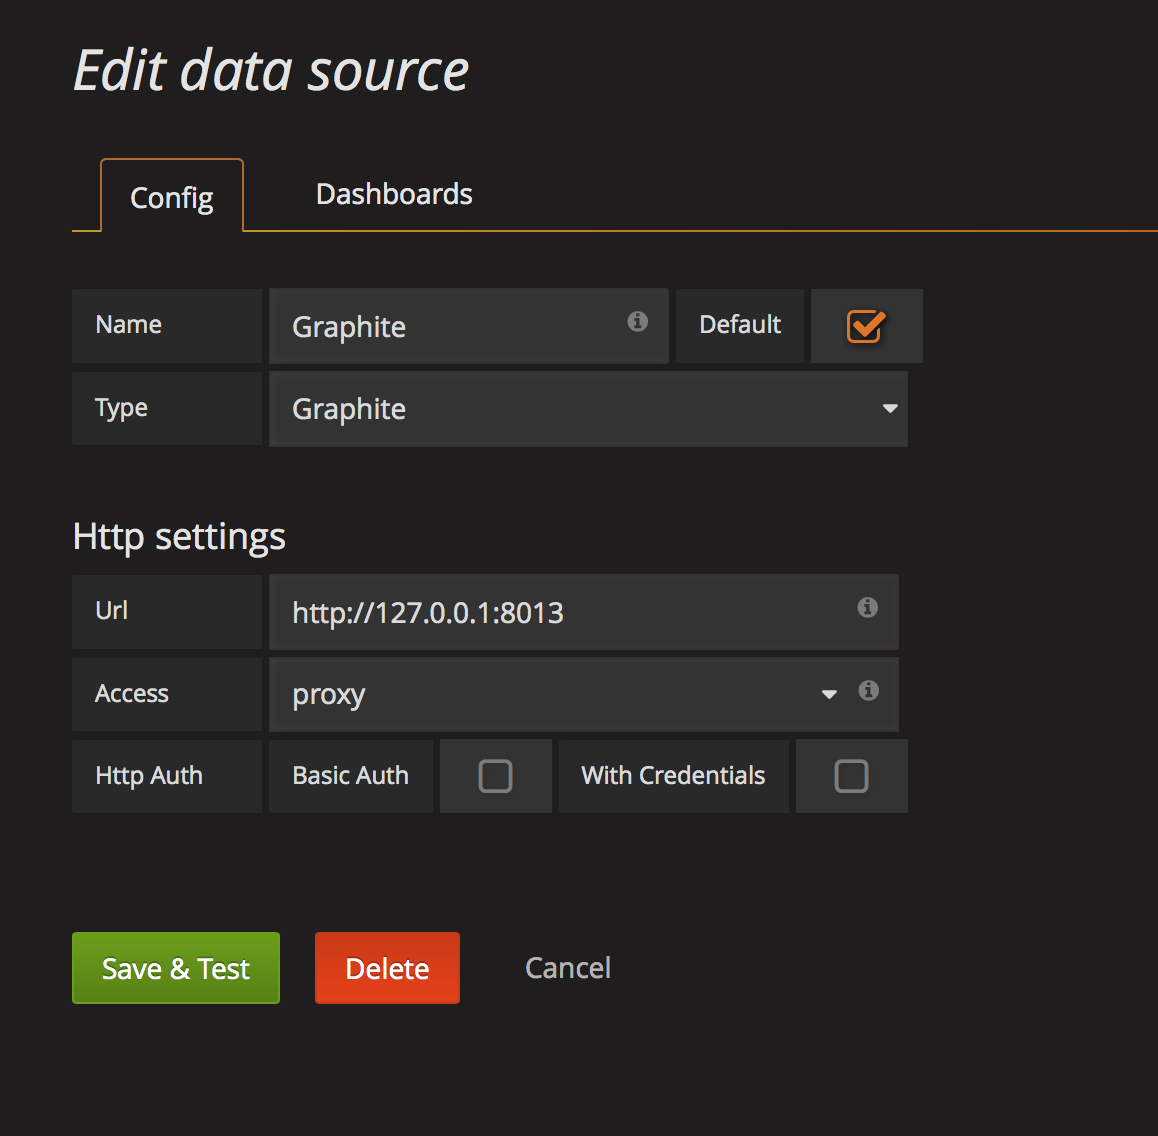 Save and we’re ready to add a dashboard!
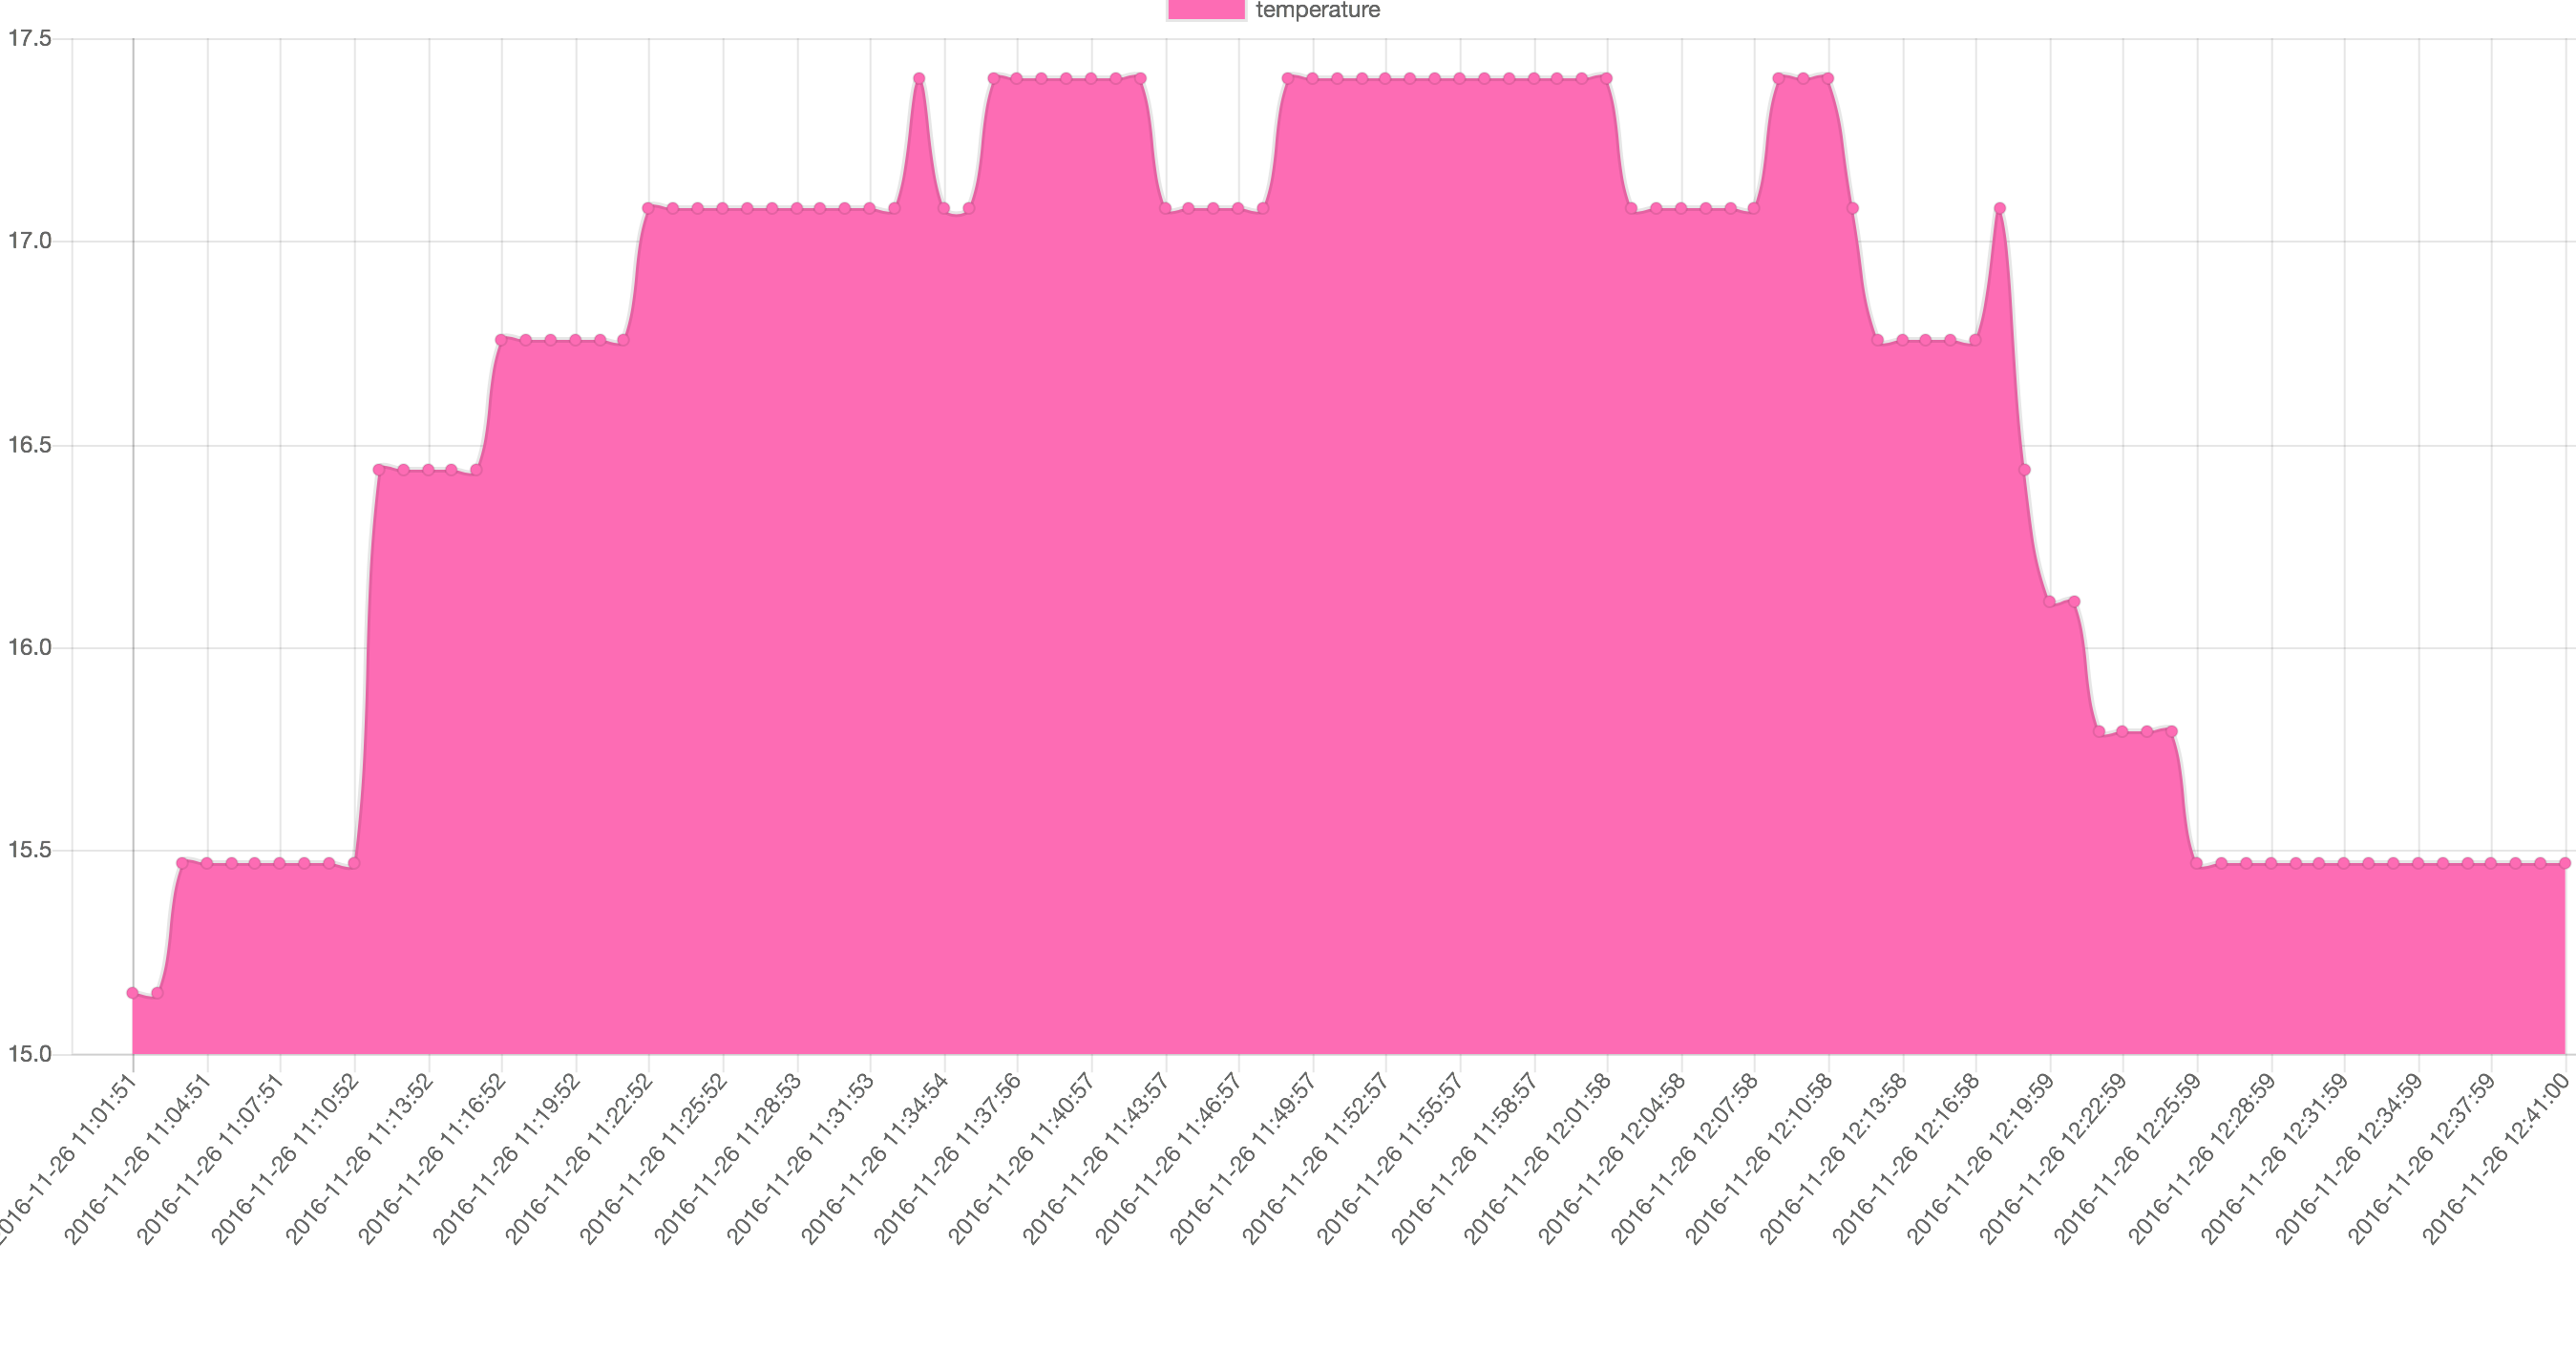
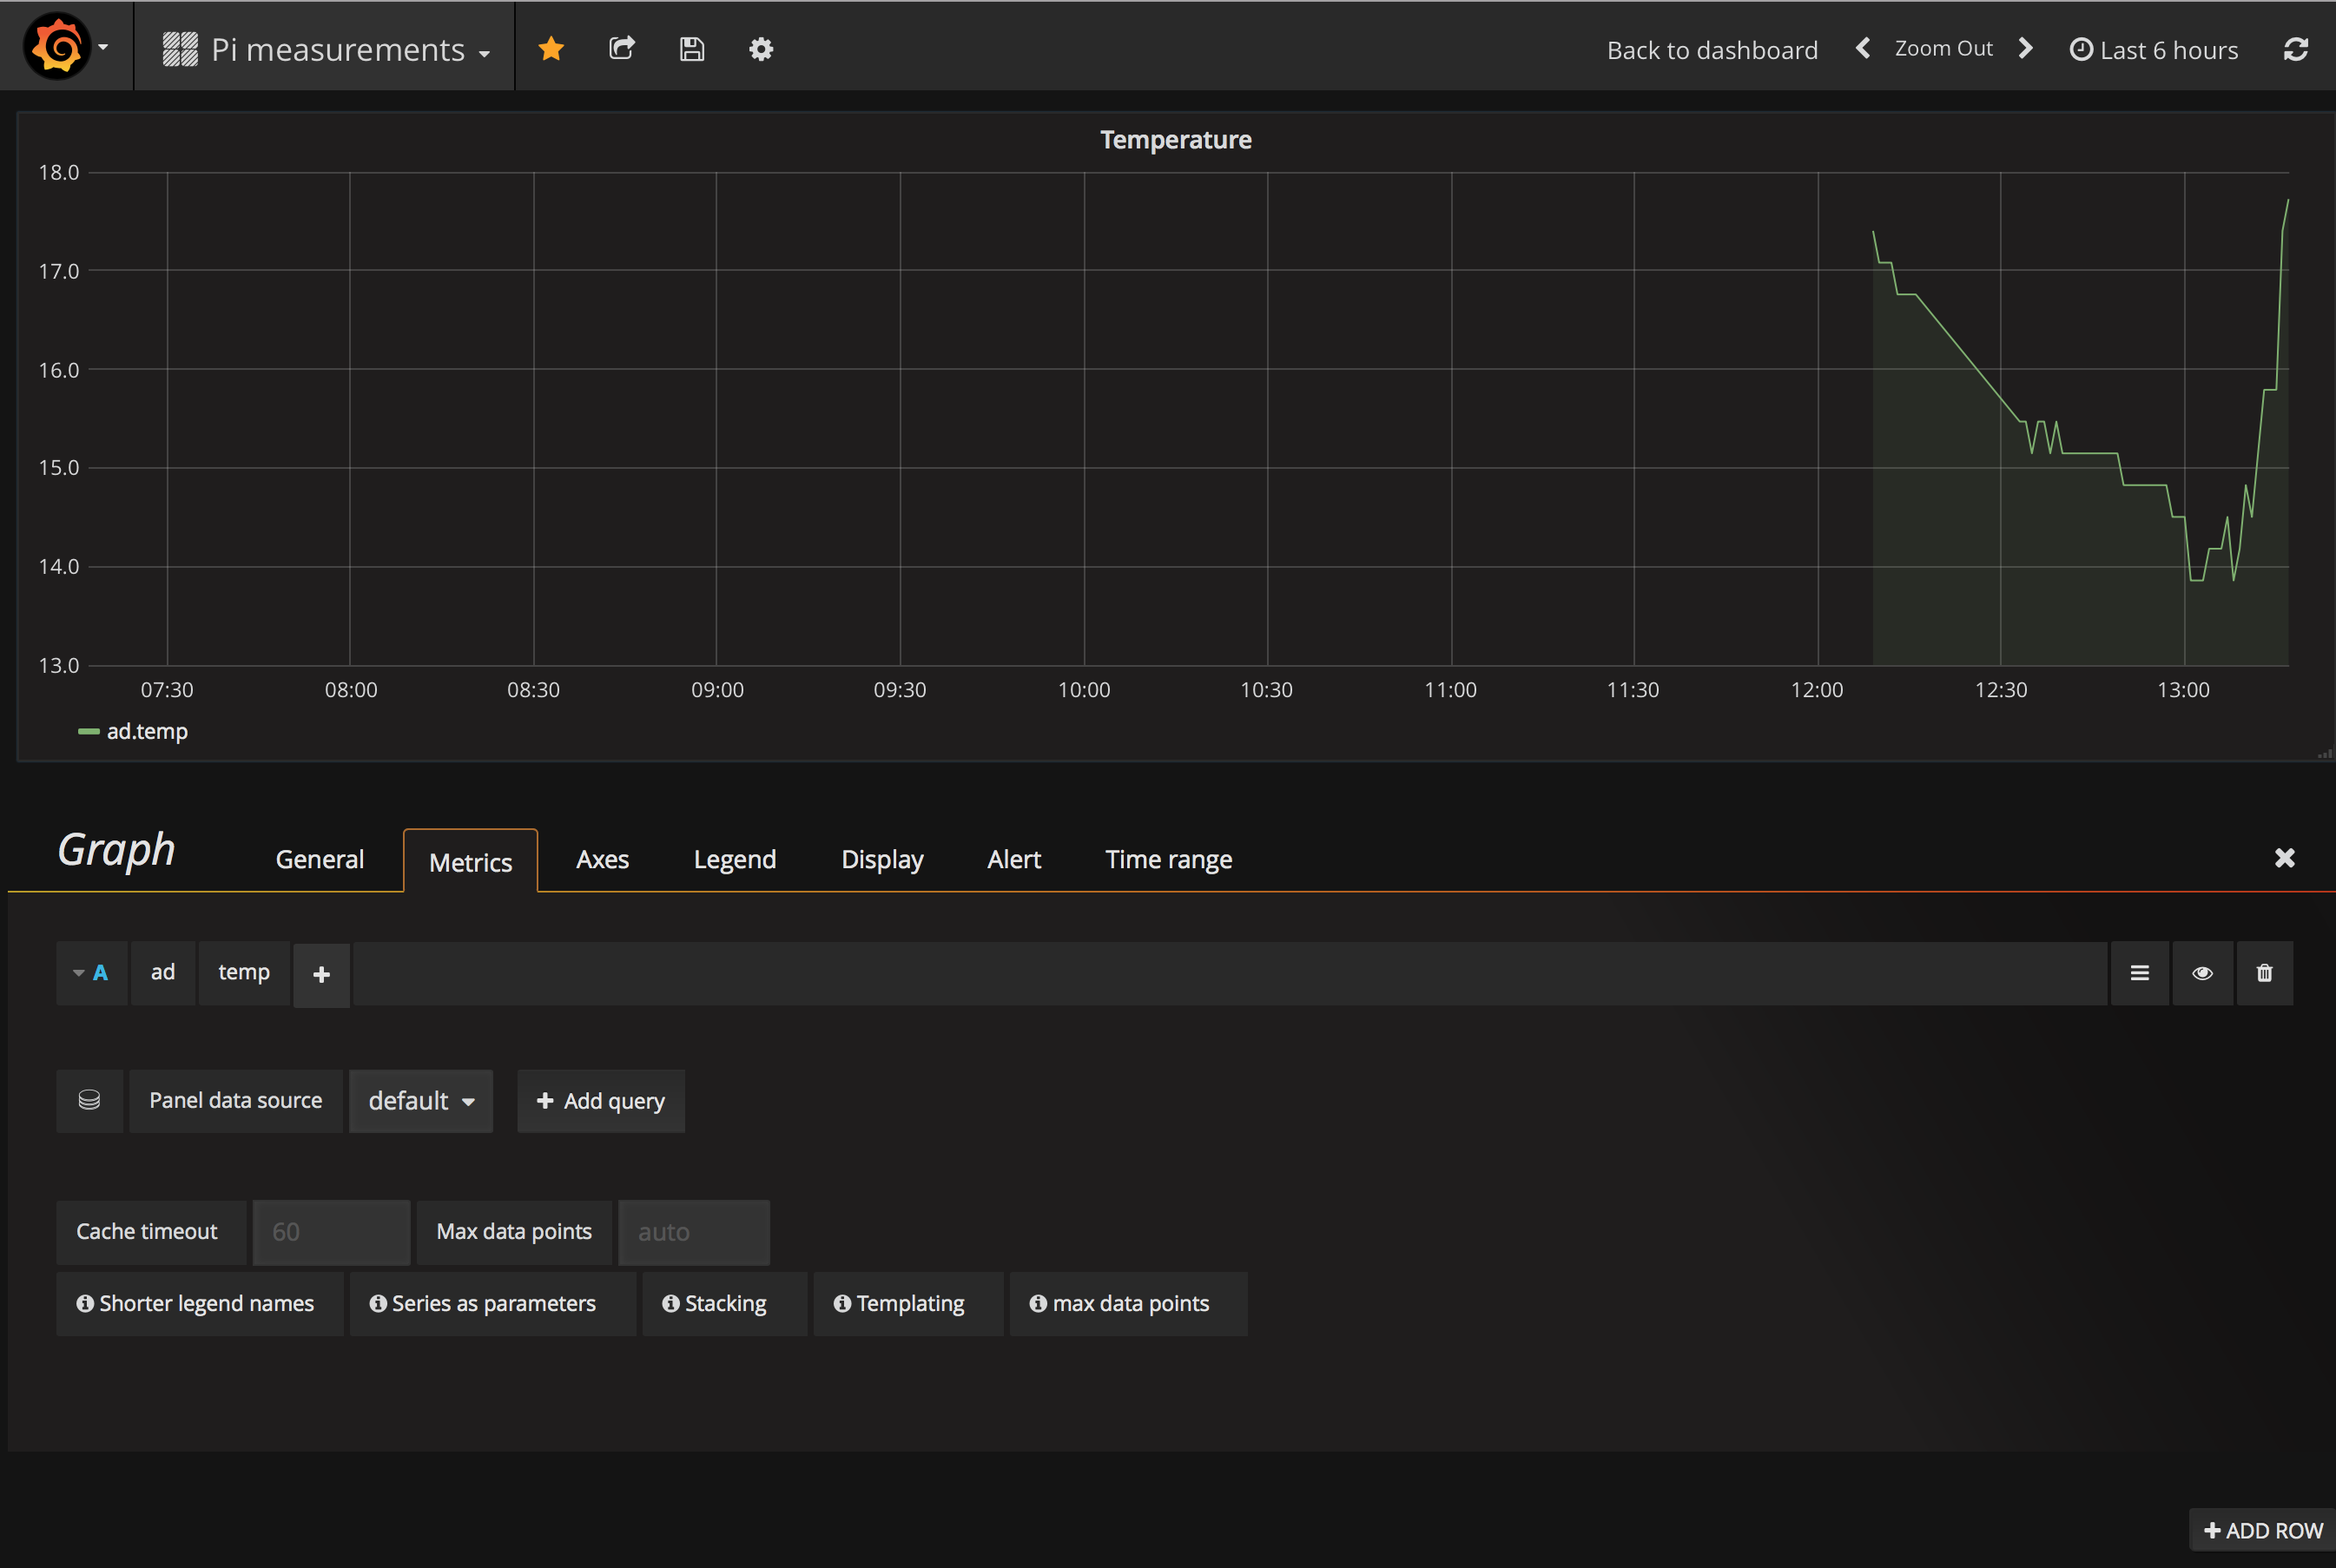
Once we added a line graph (we can add more fancy stuff but I don’t know what awesome statistical math we can take of my room temperature). As source make sure to use Graphite (did you try Elastic on the Pi? Would be fun also) and the first metric is ad (from
Save and we’re ready to add a dashboard!
Once we added a line graph (we can add more fancy stuff but I don’t know what awesome statistical math we can take of my room temperature). As source make sure to use Graphite (did you try Elastic on the Pi? Would be fun also) and the first metric is ad (from ad.temp) and the second one of course is temp. This will fetch the data we sent with the Python script and starts plotting it!
 Save (both the graph and the dashboard) and we’re done for today!
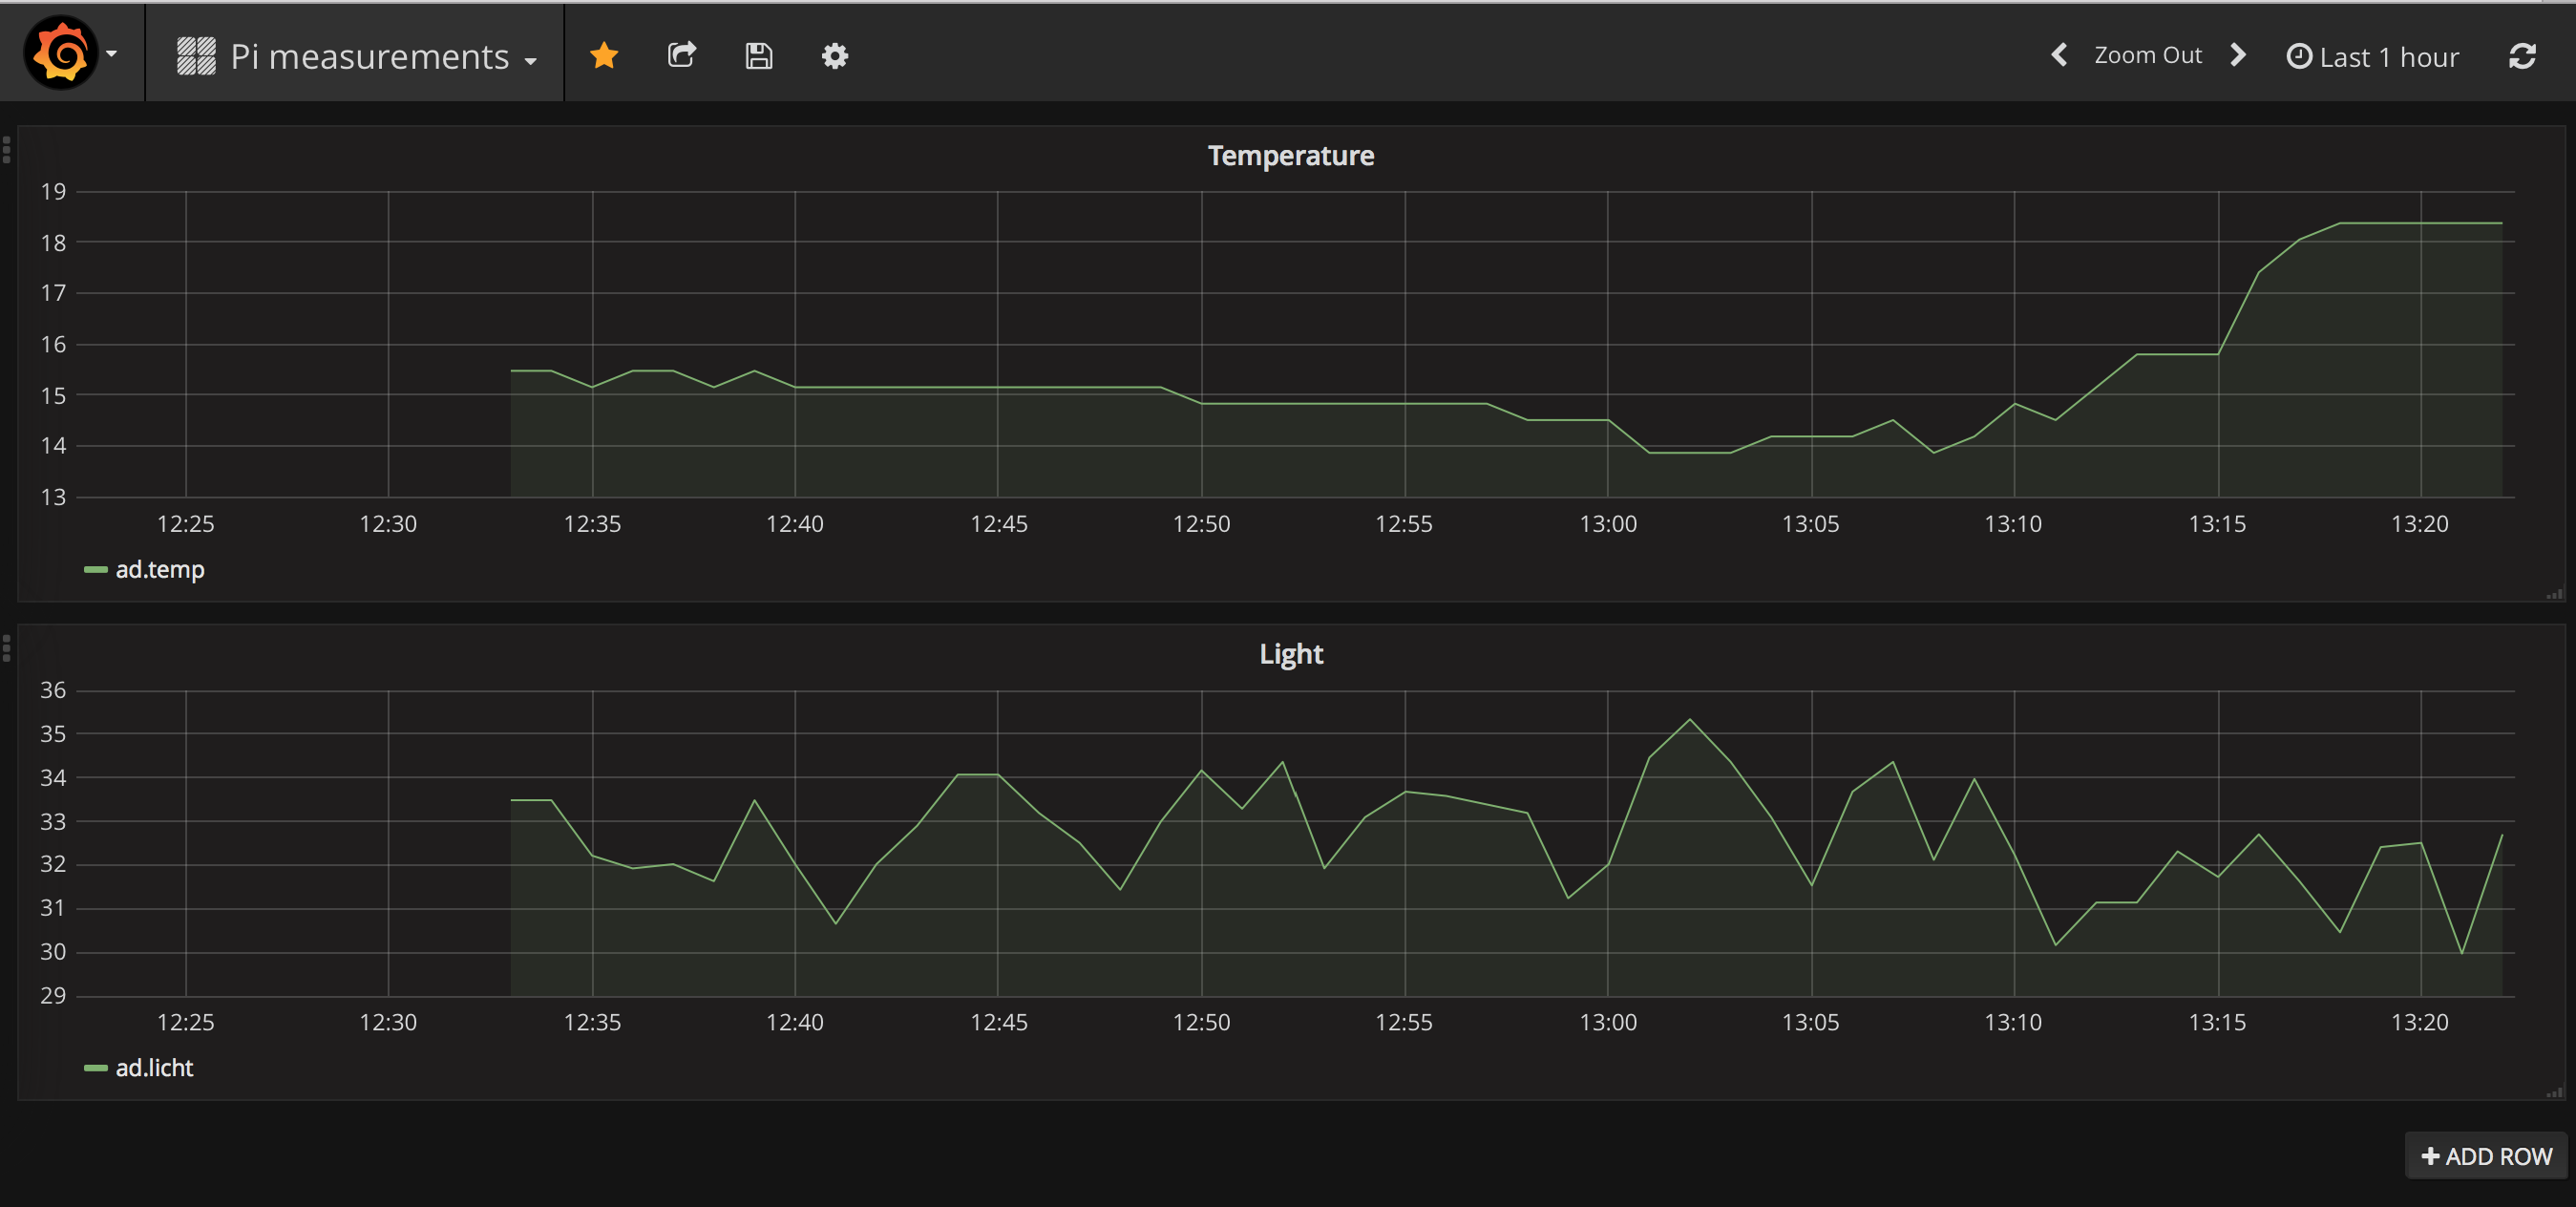 Now we have Grafana plotting all data you want from the Pi and the best of all it all runs on the Pi (those are strong machines but I posted too much about ARM servers in the past so I’ll save you from that again)
Want to view my work? https://grafana.eyskens.me/dashboard/snapshot/oF7UZ5gVnJw5tnqDx15wrHt3wT1IuYBi (note can be down it if my Pi isn’t connected)